Analysis of Hawk Mountain Wind Speed to Raptor Count Trends from 1976 through 2021
Dale E. Parson, Ph.D., 2023
Professor of Computer Science and Information Technology

Kutztown University of Pennsylvania

parson@kutztown.edu
https://faculty.kutztown.edu/parson/


For a quick read, jump to Section 10 Correlation Tables and Conclusions
Contents:
1. Introduction
2. Trend Analysis in Climate to Red-tailed Hawk Counts by Month
3. Trend Analysis in Climate to Sharp-shinned Hawk Counts by Month

4. Trend Analysis in Climate to American Kestrel Counts by Month
5. Trend Analysis in Climate to Broad-wing Hawk Counts by Month
6. Trend Analysis in Climate to Cooper's Hawk Counts by Month
7. Trend Analysis in Climate to Osprey Counts by Month
8. Trend Analysis in Climate to Northern Harrier Counts by Month
9. Trend Analysis in Climate to Northern Goshawk Counts by Month
10. Correlation Tables and Conclusions
References


1. Introduction

This analysis of summer 2023 is a sequel to the summer 2022 Analysis of Hawk Mountain Sanctuary Observation Data from 1976 through 2021, also available as a web page through end of 2024 here. A presentation of that and subsequent analysis presented at Kutztown University in November 2022 and to Hawk Mountain researchers in January 2023 is available as PDF slides here and also on the web through 2024 here. This work was funded by a Kutztown University Research Grant for spring 2022 through summer 2023.

Analytical use of these data proceeded through a subset of projects in three courses in the 2022-2023 academic year: CSC 458 - Data Mining & Predictive Analytics I in fall, CSC 523 - Scripting for Data Science in fall, and CSC 558 - Data Mining and Predictive Analytics II in spring. These courses include iterative exploration of data relationships that often result in new discoveries and consolidation of previous discoveries.

The current document focuses on one significant data relationship, that of consistent decrease of wind speed measures at Hawk Mountain's North Lookout, called regional stilling [1], to declining counts in certain raptor species from September through November in the later years of 1976 through 2021.
"According to a recent study in Nature, the Arctic has, since 1979, been warming four times faster than the rest of the world. That’s much quicker than scientists had previously thought, and this warming could presage an even steeper decline in wind than anticipated. Another factor possibly contributing to stilling is an increase in “surface roughness” — an uptick in the number and size of urban buildings, which act as a drag on winds.

Wind has been an overlooked element of climate change studies, which helps explain why the debate over these trends continues. The field is young, with only 70 years of data — temperature data, by contrast, goes back thousands of years — and wind systems are notoriously difficult to study and analyze. Substantial annual fluctuations make long-term trends difficult to detect, and conclusions are rarely firm." [1]
Course work has uncovered the fact that certain weeks during the autumn observation period have seen more pronounced decreases in average wind speed, raptor counts, and corresponding increases in air temperature than other weeks. This analysis is based only on observations made at North Lookout. The summer 2022 study includes NOAA weather data from the Allentown, PA Airport. However, the urban climate at that site differs significantly from North Lookout, largely because of Heat Island Effect [2] and excessive truck pollution [3] in the Lehigh Valley.

Figure 1 shows the location of Hawk Mountain's North Lookout on the Kittatinny Ridge that runs southwest from northern New Jersey to central Pennsylvania. Figure 2 shows a zoomed-out view.

Zoomed
            in Kittatinny Ridge

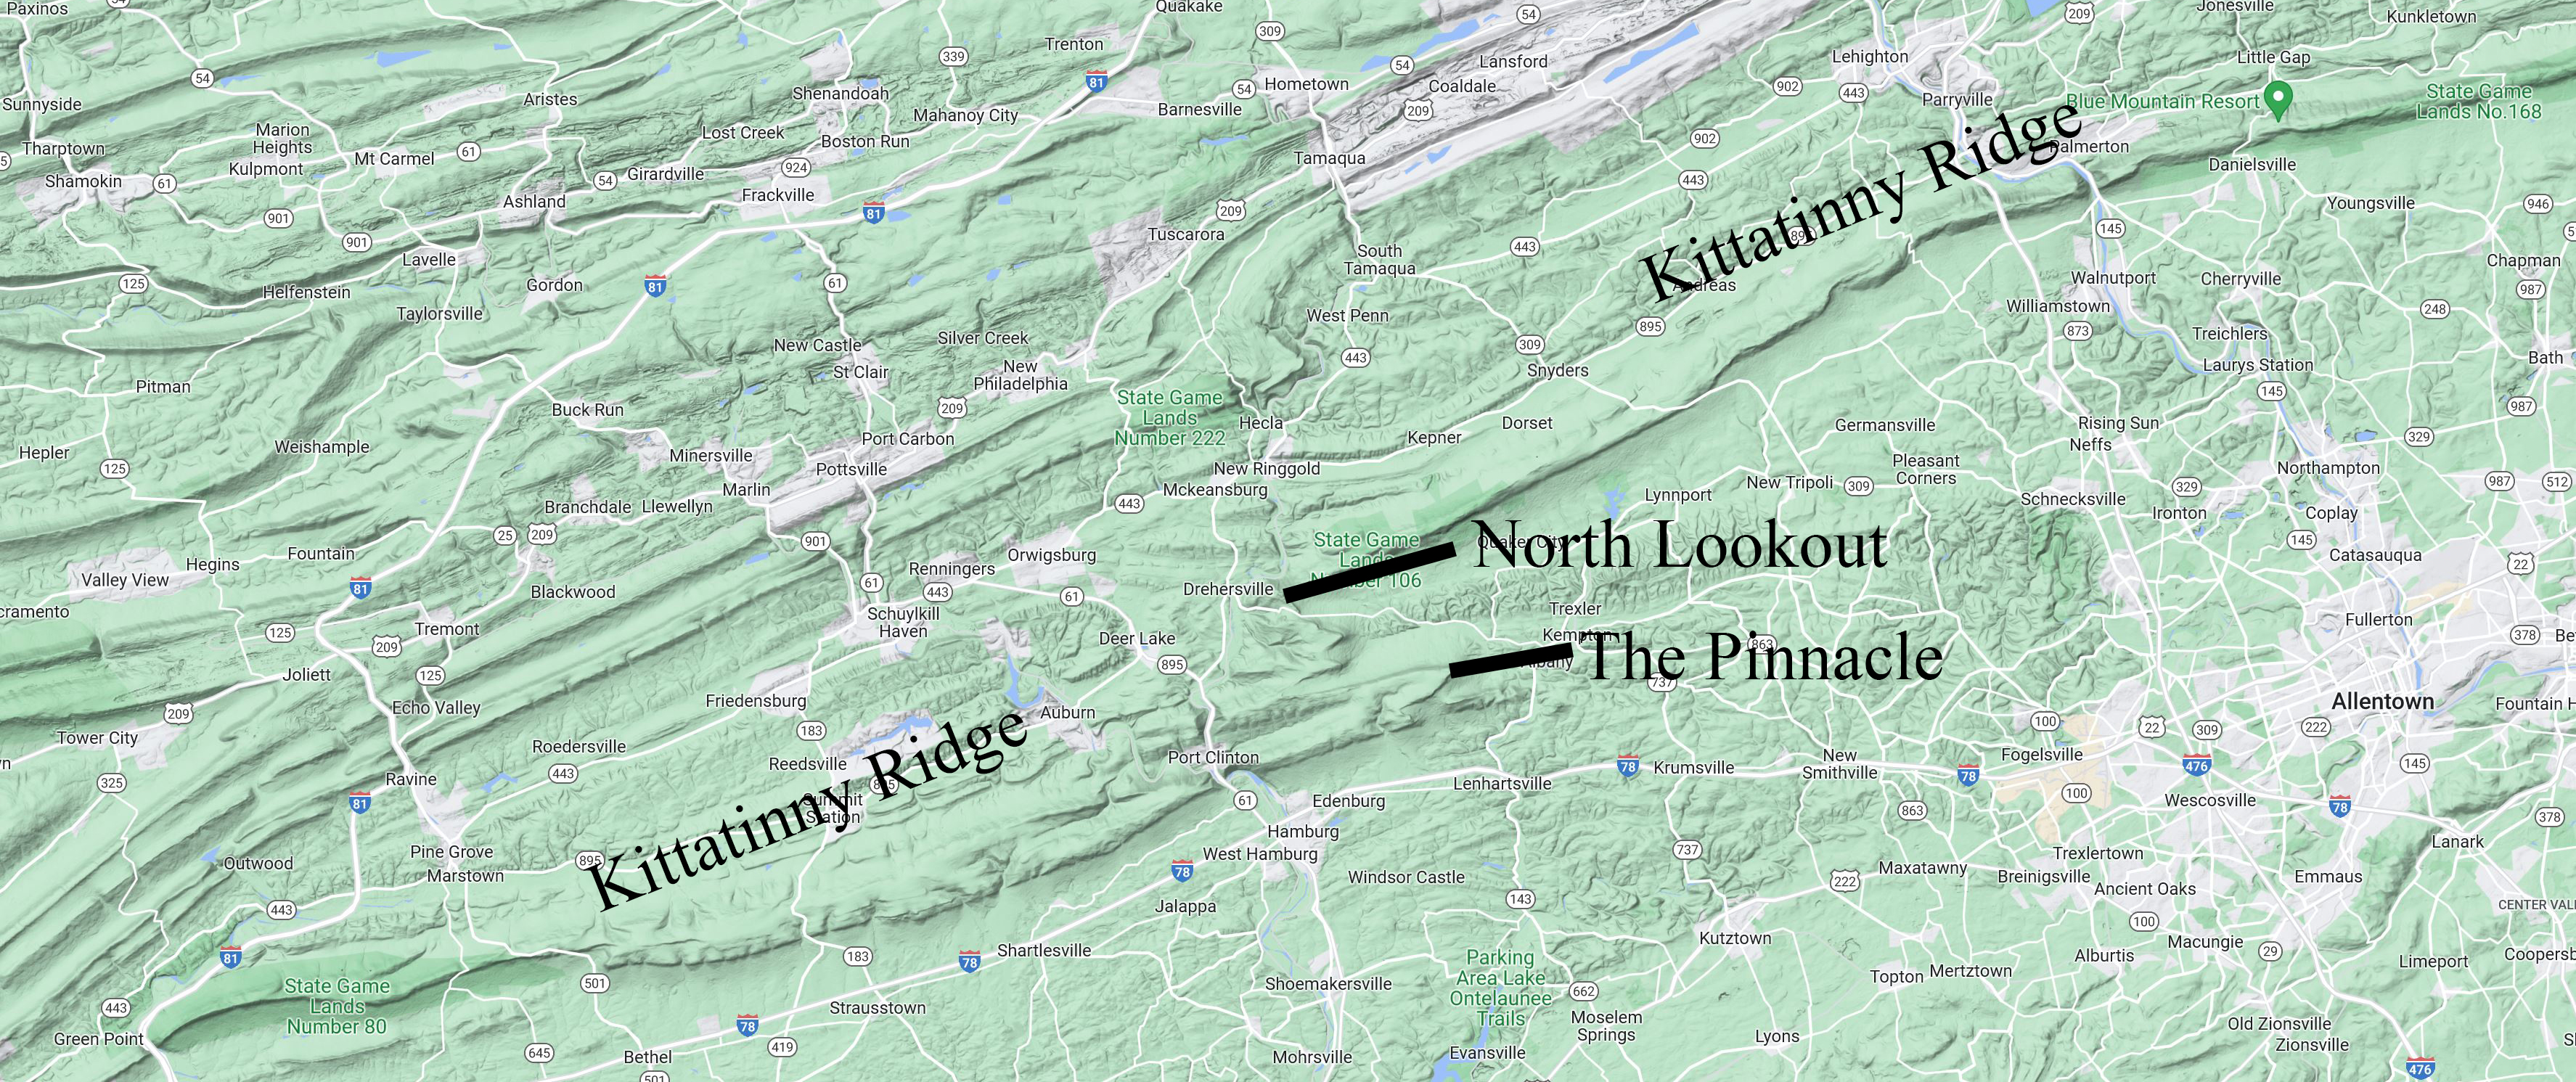
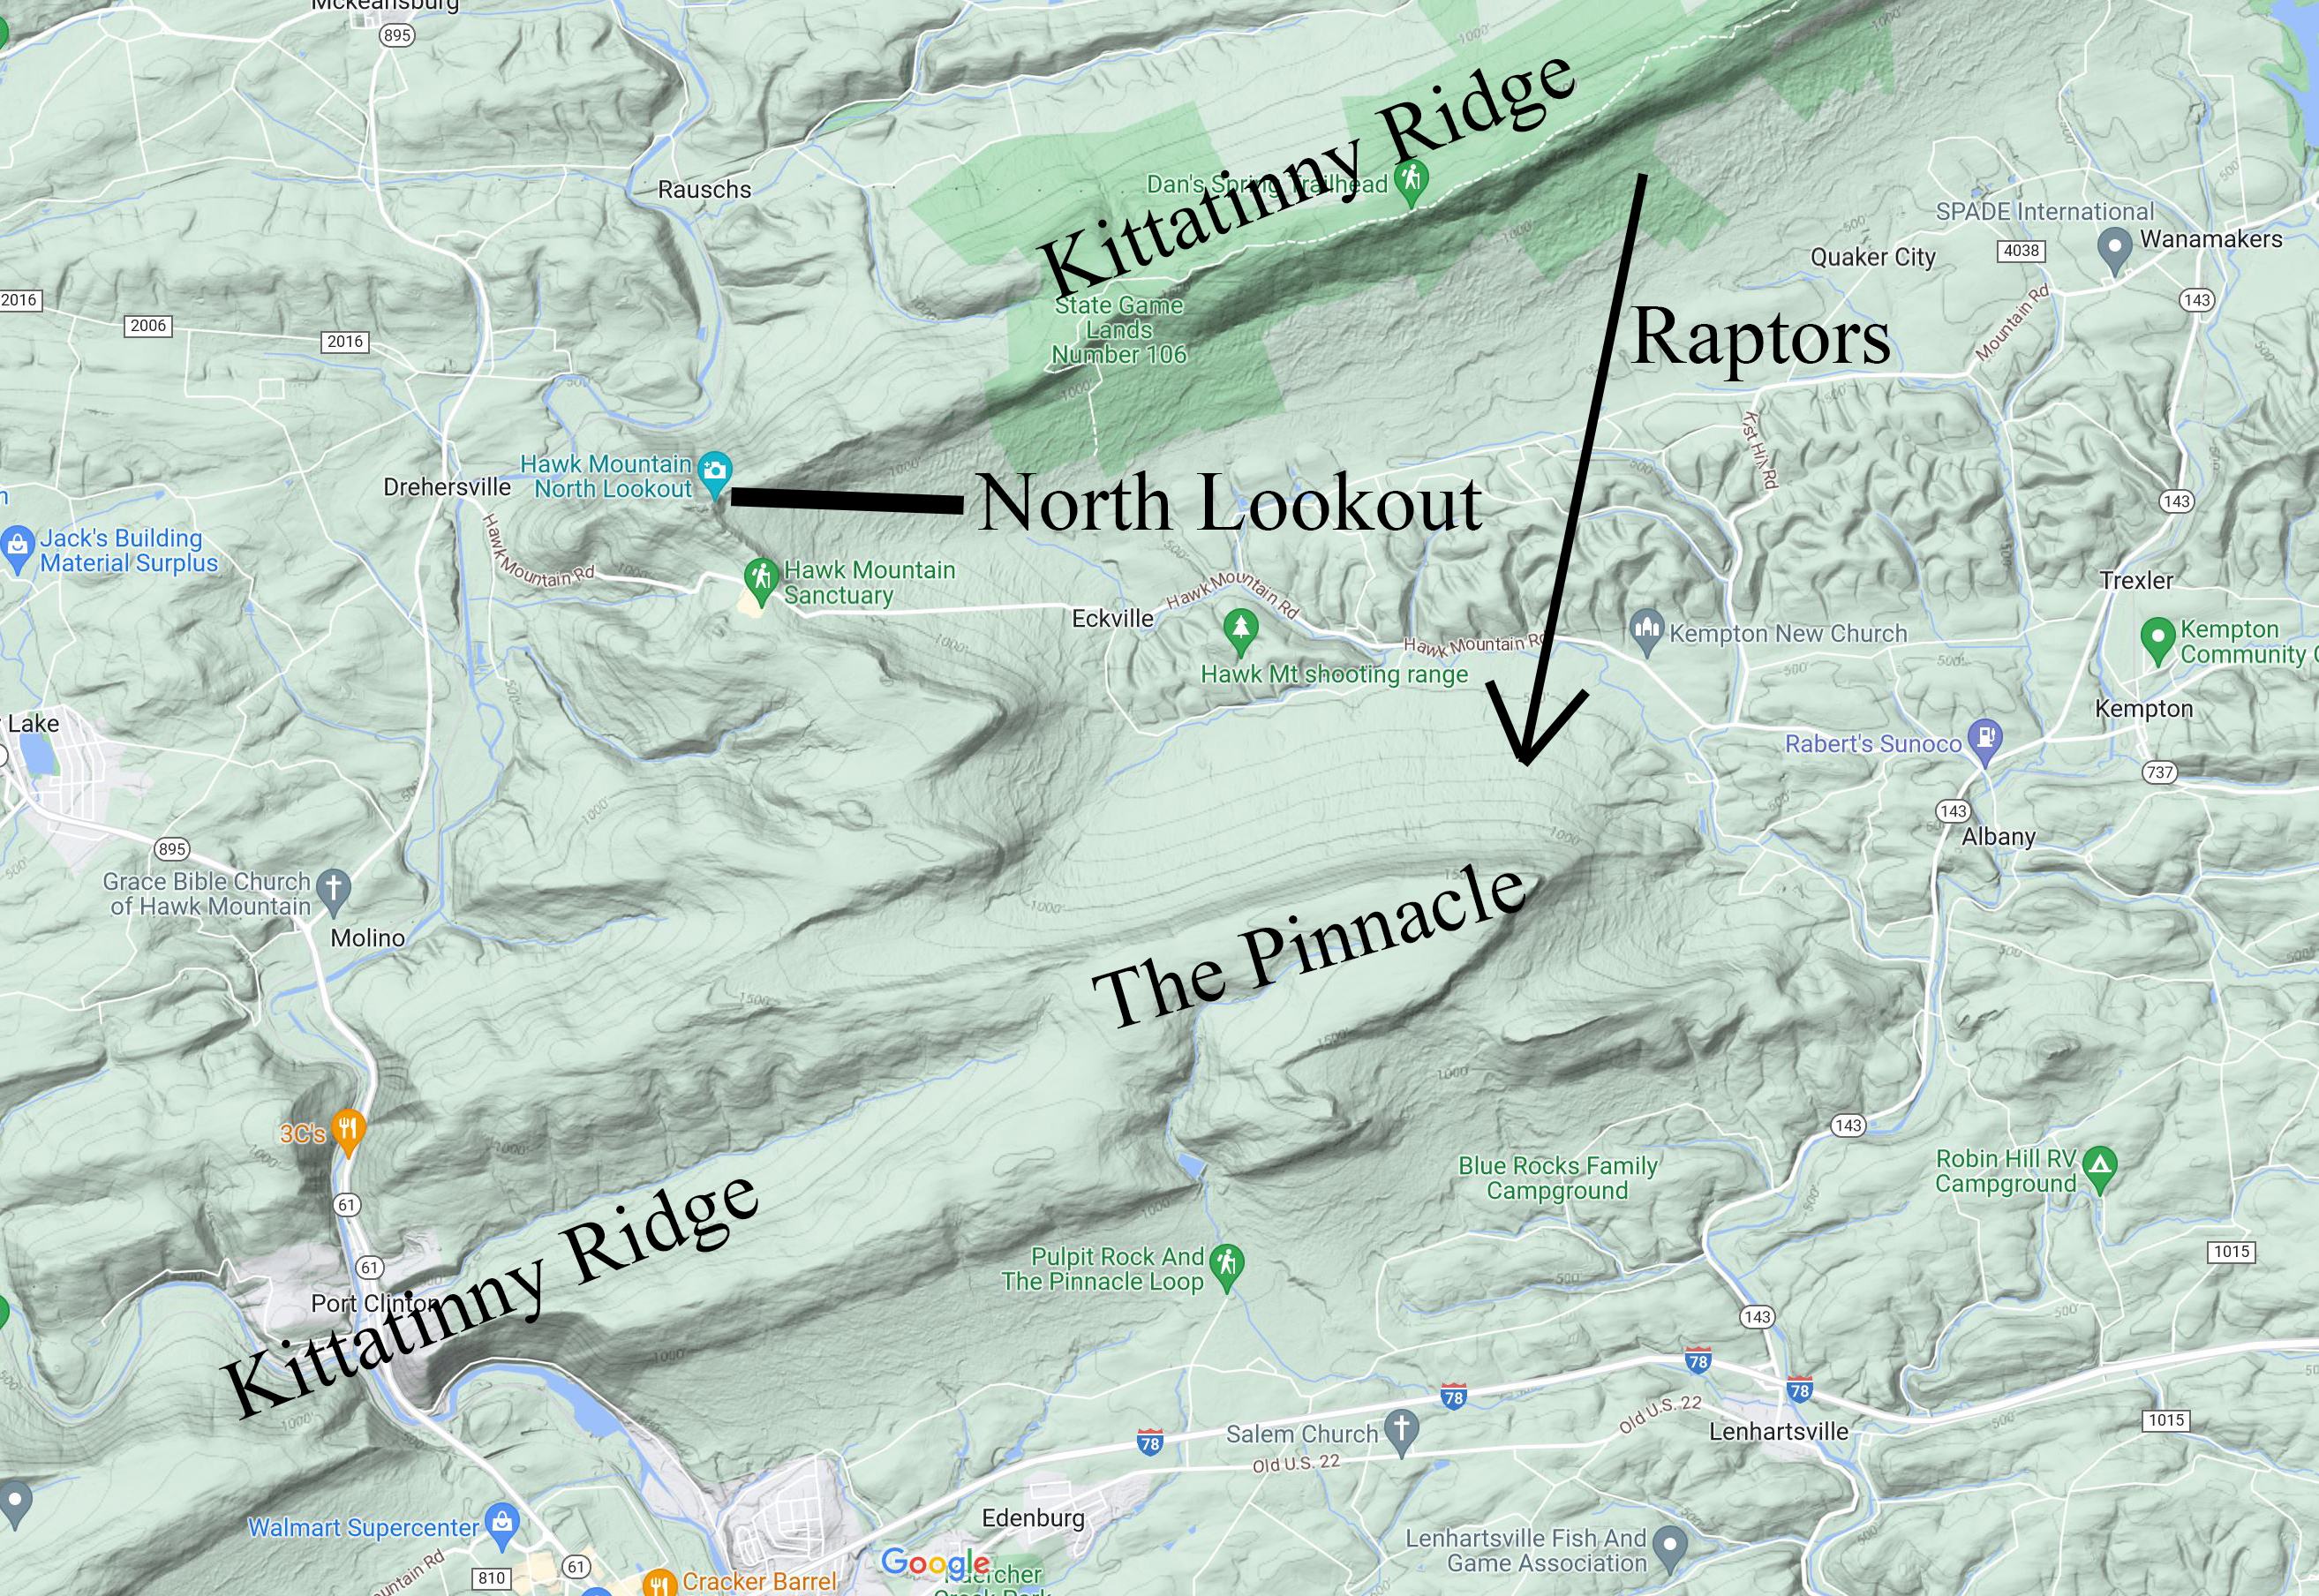
Figure 1: Kittatinny Ridge in the Hawk Mountain Area, from https://www.google.com/maps
Search for "Hawk Mountain North Lookout" in the terrain view.
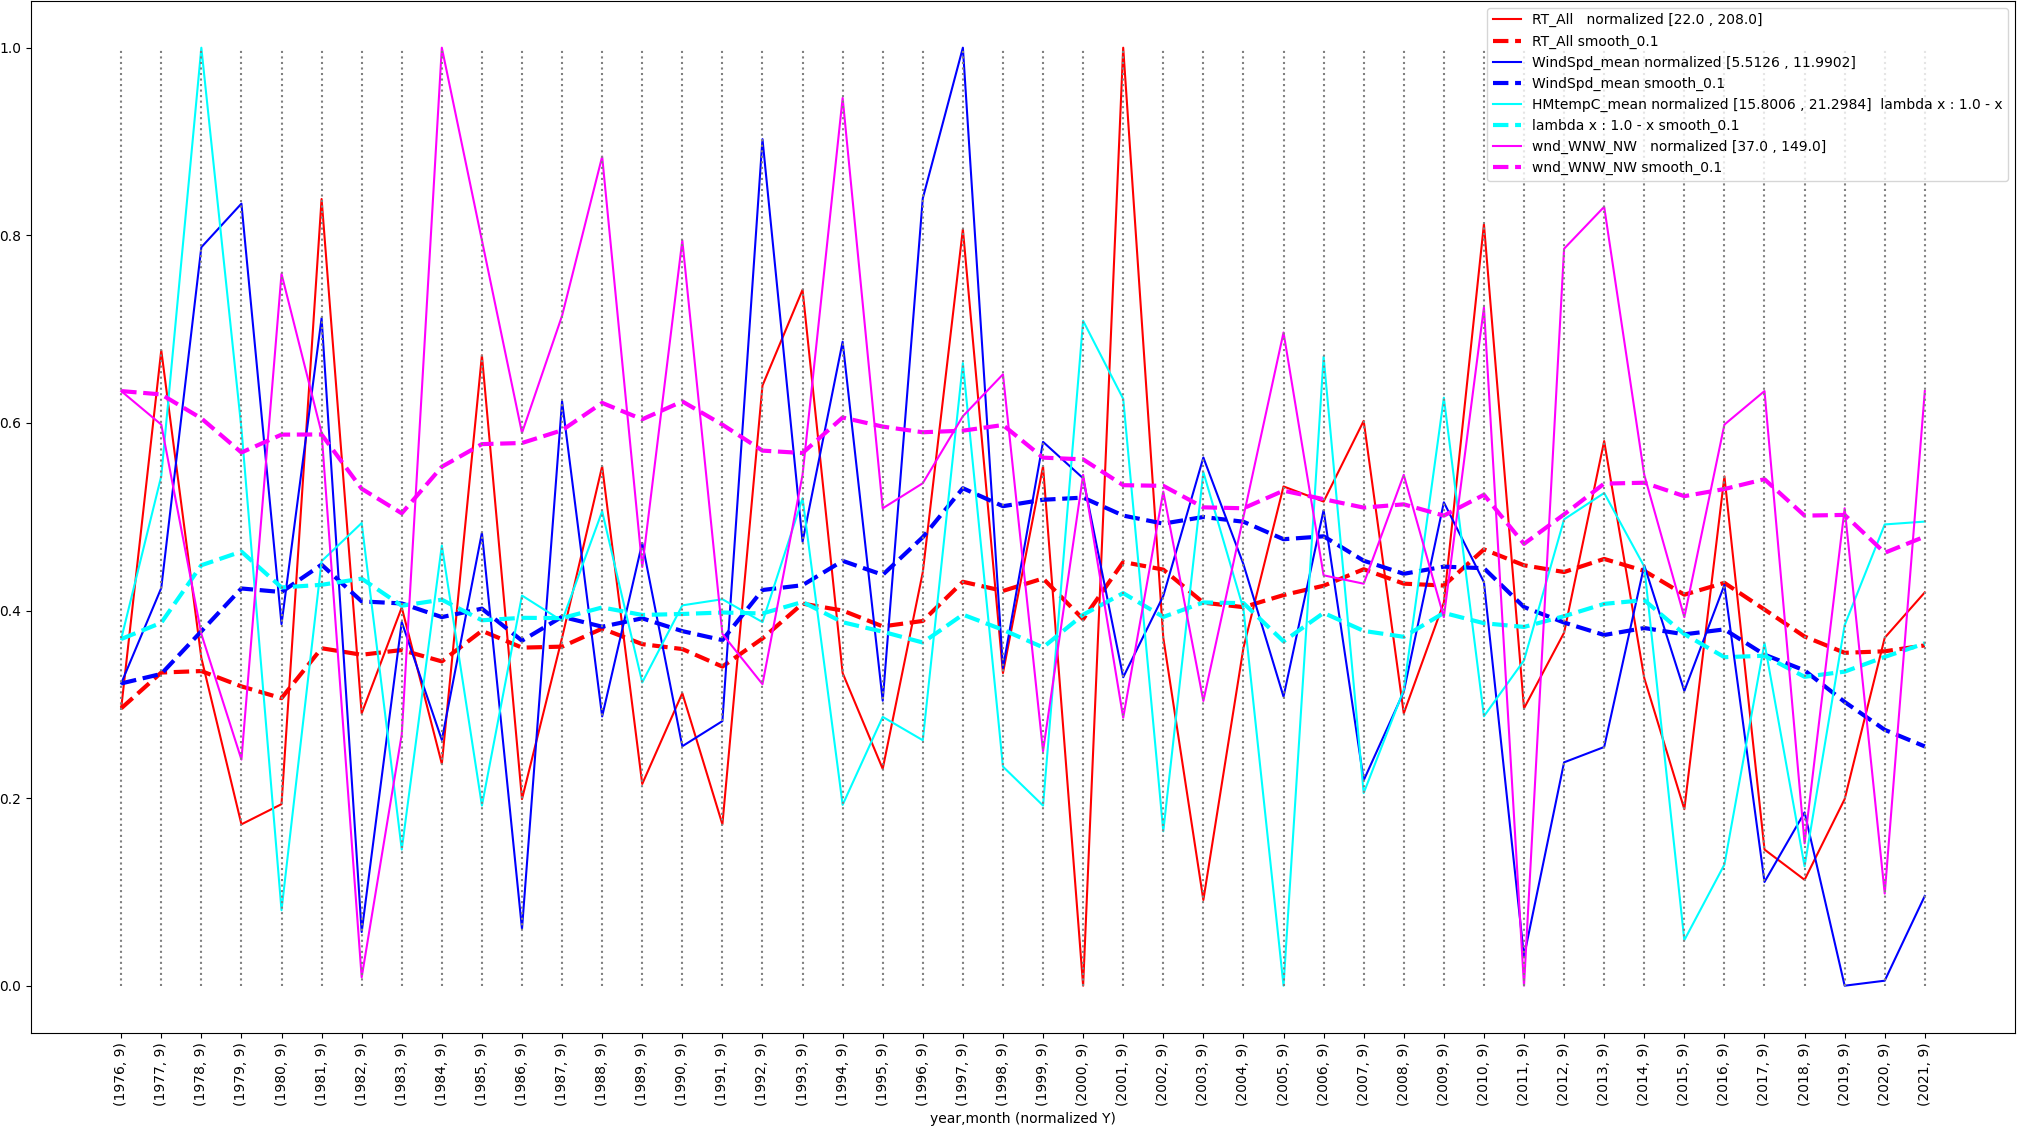
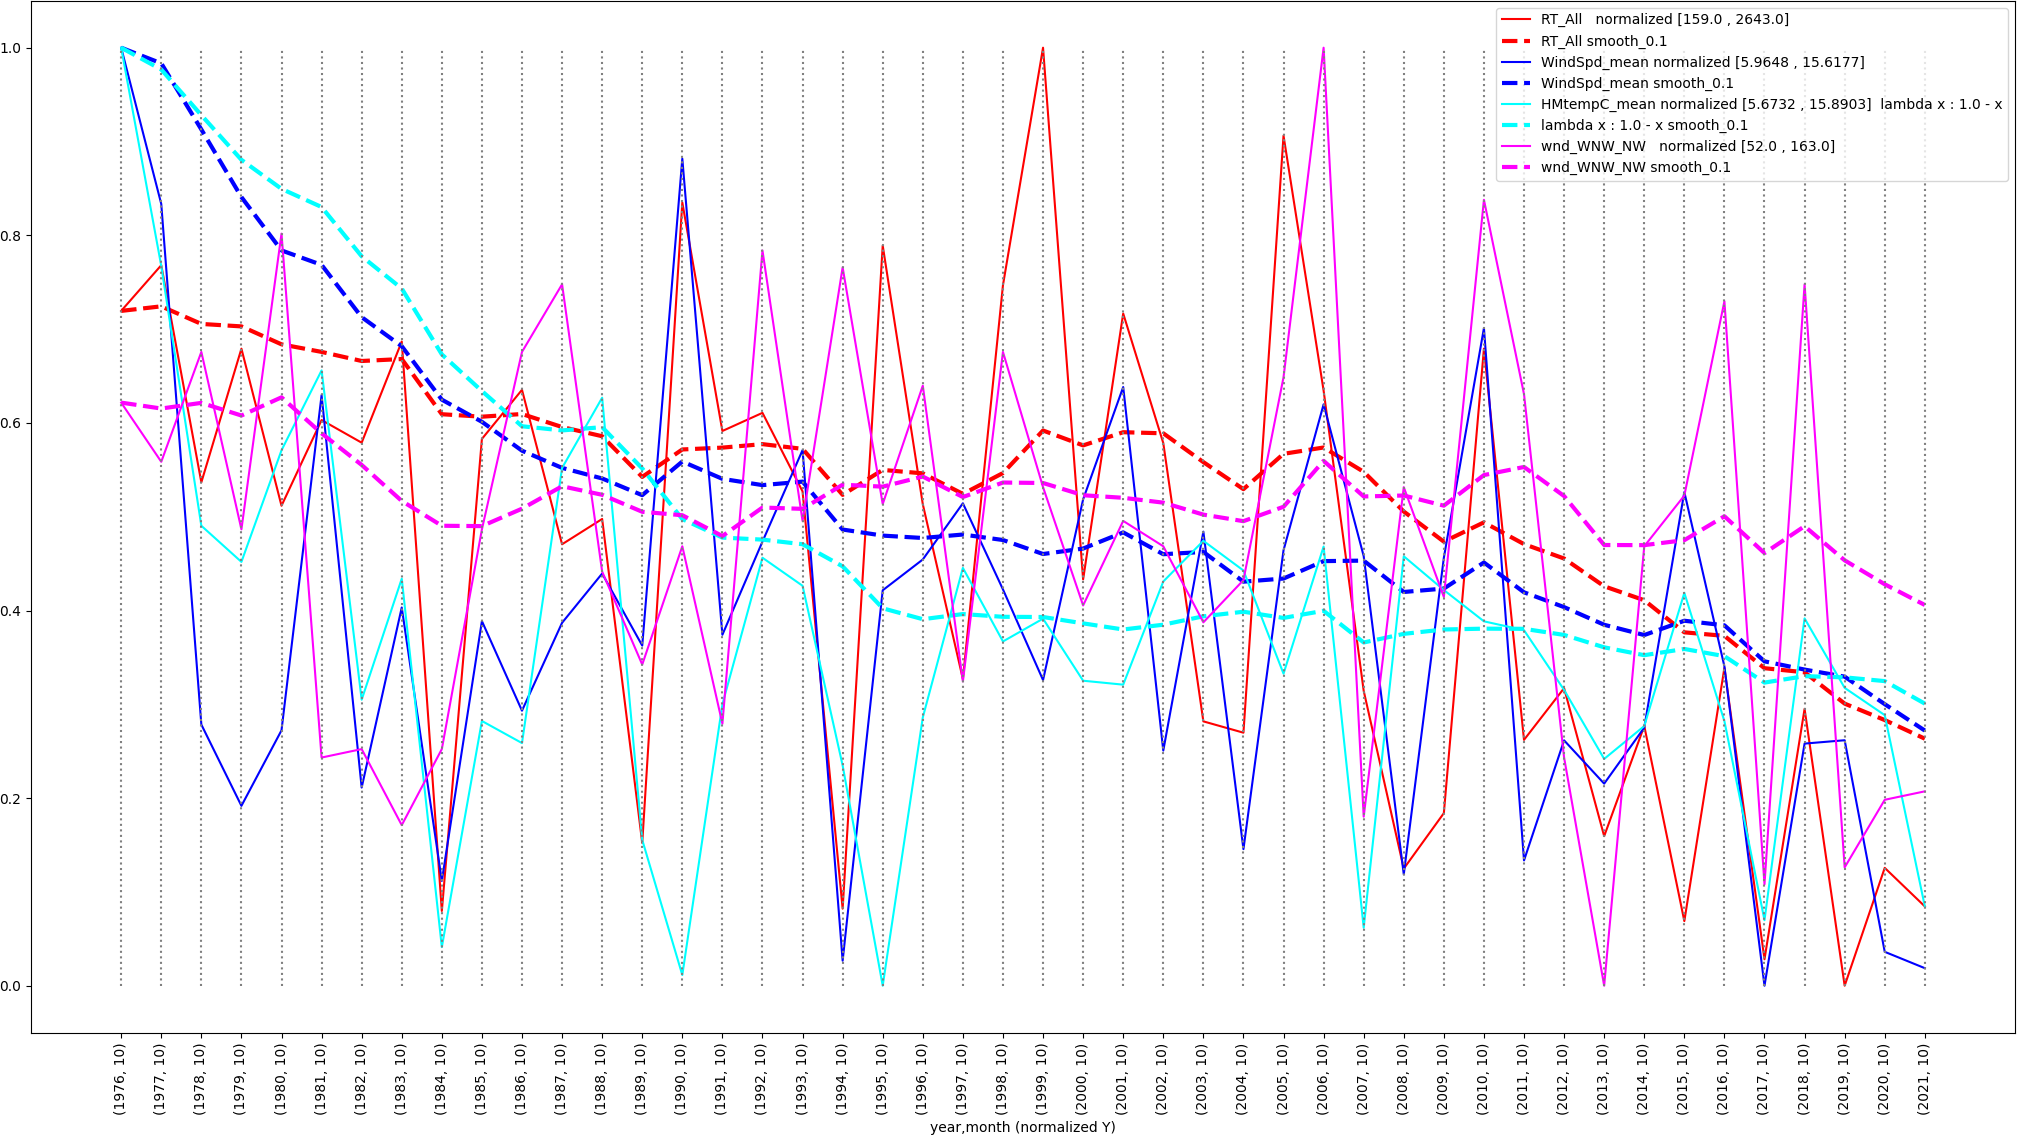
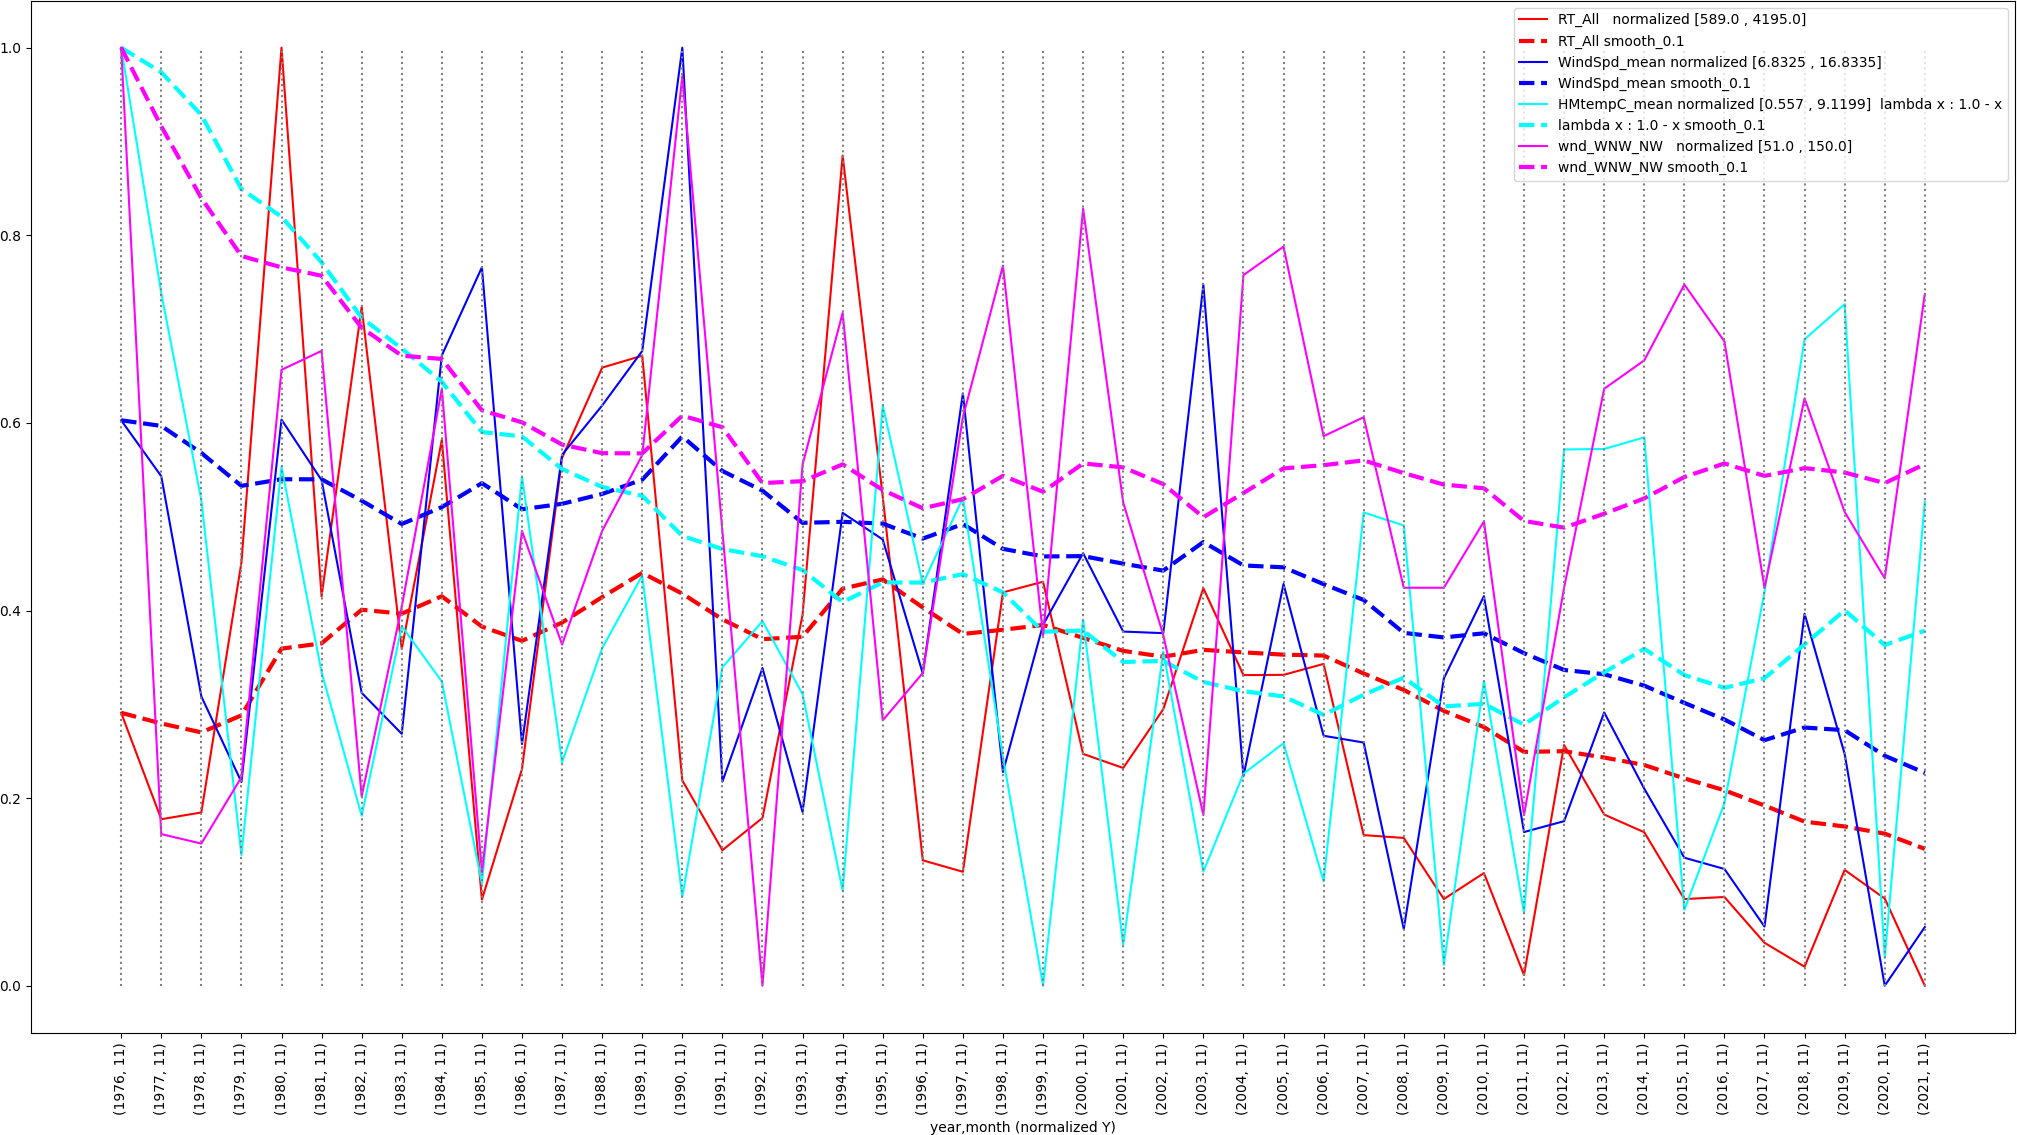
Kittatinny Ridge zoomed out

Figure 2: Zoomed out Kittatinny Ridge

Certain raptor species partially coast on updrafts along the north side of the ridge when predominately northwest winds are present [4]. The physical discontinuity in the ridge at the Eckville Fault makes it necessary for raptors to cross in the area of North Lookout in order to use updrafts at the Pinnacle and to the southwest, since the North Lookout's ridge drops to the valley directly to the southwest. This discontinuity acts as a funnel for steering raptors utilizing updrafts.

The next sections discuss raptor species whose seasonal counts correlate highly with declining winds that cause updrafts along the north side of Kittatinny Ridge.

2.  Red-Tailed Hawks (RT)

This section displays graphs and models for wind speed, wind direction, air temperature, and red-tailed hawk count trends. Subsequent sections cover other species with substantial correlations to these attributes.

RT Sep

Figure 3: Normalized Red-tailed Hawk Counts and their Exponentially Smoothed Trends for September 1976 through 2021

Figure 3 and the graphs that follow show two sets of values across the years. The thin solid lines show normalized counts, where normalization maps a given year's monthly value into the range [0.0, 1.0] via the formula NormalizedValue = ((Value - MinValue) / (MaxValue - MinValue)). A normalized value is that fraction of the way from the minimum value to the maximum value for that attribute within the time frame September 1976 through 2021. If we know the MinValue and MaxValue we can find the original Value = NormalizedValue * (MaxValue - MinValue) + MinValue. The legend for these values in Figure 3 gives the
MinValue and MaxValue for each data attribute, e.g., MinValue is 22 and MaxValue is 208 for the red-tailed count tally (RT_All) in September for these years. WindSpd_mean is the normalized mean wind speed for September in the range [5.5126, 11.9902] kilometers/hour. HMTempC_mean in these graphs is the inverted normalized average temperature Celsius at North Lookout in the range [15.8006, 21.2984] degrees. Inverting the normalized mean temperature value means subtracting the normalized value in the range [0.0, 1.0] from 1.0 so that an upward slope becomes a downward slope and vice versa. Inverting the slope aligns it with the decrease in wind speed. Finally, wnd_WNW_NW is the normalized sum of west-northwest and northwest wind counts for that month, accounting for the fact that observers began using three-letter direction designations such as WNW in 1995 [5]. Northwesterly winds are significant because they drive the updrafts on the north side of the ridge [4].

The heavy dashed lines in these graphs are the exponentially smoothed values for their corresponding attributes. A smoothed value in these graphs is SmoothedValuetimeT = (alpha X NormalizedValuetimeT) + ((1.0 - alpha) X
NormalizedValuetimeT-1), with fractional multiplier alpha in the range [0.0, 1.0]. The graphs in this discussion use alpha = 0.1 to smooth the peaks and valleys in the normalized values in order to show long-term trends and slopes. [6]

Following these graphs are Linear Regression models and the Pearson Correlation Coefficient (CC) [9] of each linear model for the smoothed data of the figures, where a CC of 0.0 means no correlation of the model to the data, a CC of 1.0 is perfect correlation, and -1.0 is perfect negative correlation. Other error measures would be harder to interpret because of the normalization and smoothing of the original data. Models were extracted using the Weka machine learning toolkit [7]. Only the four attributes RT_All_smooth, WindSpd_mean_smooth, HMtempC_mean_smooth, and wnd_WNW_NW_smooth that appear in the graphs contribute to these models unless otherwise noted.

Smoothed Linear Regression Model for September 1976 through 2021
RT_All_smooth =
      0.388  * HMtempC_mean_smooth +
      0.398  * WindSpd_mean_smooth +
     -0.4227 * wnd_WNW_NW_smooth +
      0.2228
Correlation coefficient                  0.6638

Modeling 2008 through 2021 when the smoothed attribute slopes of Figure 3 roughly converge increases the CC about 29%:

Smoothed Linear Regression Model for September 2008 through 2021
RT_All_smooth =

     -0.6499 * HMtempC_mean_smooth +
      0.3825 * WindSpd_mean_smooth +
      0.6818
Correlation coefficient                  0.8565

Unlike the graphs, the HMtempC_mean_smooth trends and HMtempC_mean temperature values in the models are not inverted. Inversion in the graphs is for visual comparison of trend slopes. The models do not need this inversion. A negative multiplier such as -0.6499 indicates a substantial decrease in RT_All_smooth as HMtempC_mean_smooth increases and vice versa.

RT Oct

Figure 4: Normalized Red-tailed Hawk Counts and their Smoothed Trends Parallel other trends for October 1976 through 2021

The range of red-tailed hawk counts in Figure 4 for October, [159, 2643], is much higher than [22, 208] for Figure 3 of September, a more statistically significant sample size.

Smoothed Linear Regression Model for October 1976 through 2021
RT_All_smooth =
      0.5387 * HMtempC_mean_smooth +
      1.1919 * WindSpd_mean_smooth +
     -0.3542
Correlation coefficient                  0.8431

Modeling 1990 through 2021 when the smoothed attribute slopes of Figure 4 roughly converge increases the CC about 9%.
WindSpd_mean_smooth is the strongest contributing attribute in terms of its multiplier in the linear expression, with HMtempC_mean_smooth coming in second. Normalization puts all attributes on the same scale so that the multipliers are comparable.
 

Smoothed Linear Regression Model for October 1990 through 2021
RT_All_smooth =
      0.8032 * HMtempC_mean_smooth +
      1.6502 * WindSpd_mean_smooth +
      0.5137 * wnd_WNW_NW_smooth +
     -0.9813
Correlation coefficient                  0.9211


RT Nov

Figure 5: Normalized Red-tailed Hawk Counts and their Smoothed Trends Parallel Wind trends for November 1976 through 2021

The range of red-tailed hawk counts in Figure 5 for November, [589, 4185], is much higher than [159, 2643] for Figure 4 of October, again a more statistically significant sample size.

Smoothed Linear Regression Model for November 1976 through 2021
RT_All_smooth =
      0.9035 * WindSpd_mean_smooth +
     -0.4434 * wnd_WNW_NW_smooth +
      0.1867
Correlation coefficient                  0.9327

Modeling 1985 through 2021 when the smoothed attribute slopes of Figure 5 roughly converge increases the CC about 3% over an already-high CC.
WindSpd_mean_smooth is the strongest contributing attribute in terms of its multiplier in the linear expression, with HMtempC_mean_smooth again coming in second. As always, normalization puts all attributes on the same scale so that the multipliers are comparable.

Smoothed Linear Regression Model for
November 1985 through 2021
RT_All_smooth =
      0.148  * HMtempC_mean_smooth +
      0.9239 * WindSpd_mean_smooth +
     -0.1567
Correlation coefficient                  0.9604

A final model to consider uses the normalized values of the four attributes of Figure 5 without smoothing for long-term trends, i.e., the thin solid lines of Figure 5. While the CC is only about a third of the preceding, smoothed model, and an average error of 532 raptors in the range
[589, 4185] of Figure 5, it is significant in identifying as the main attribute of influence .WindSpd_mean

Un-smoothed, Normalized Linear Regression Model for November 1985 through 2021
RT_All =
   1425.1292 * WindSpd_mean +
   1012.5687
Correlation coefficient                  0.3208
Mean absolute error                    531.9956

A non-linear Decision Stump tree gives a 26% improvement in CC over Linear Regression while identifying un-normalized, un-smoothed
WindSpd_mean as the primary attribute of influence. The un-normalized nature of this model allows us to locate the decision point of WindSpd_mean = 11.5 km/hour in the range [6.8325, 16.8335] of Figure 5. These un-smoothed values take into account the peaks, valleys, and year-to-year slopes of the un-smoothed values in Figure 5.

Un-smoothed, Un-normalized Decision Stump Model for November 1985 through 2021
RT_All =   WindSpd_mean <= 11.5169615 : 1275.0
    WindSpd_mean > 11.5169615 : 2254.0
    WindSpd_mean is missing : 1513.1351351351352
Correlation coefficient                  0.4032 Mean absolute error                    541.1215


Other studies have shown that arrival times for various raptor species are changing as a result of climate change [8]. Such changes perturb annual week-based raptor counts
by moving peak count weeks. This study investigated year-to-year weekly data but did not use it because of shifting arrival and peak raptor weeks across the years. Also, small variations in weekly climate aspects are averaged out in monthly explorations of the data. Subsequently, this study examines only annual per-month data. Annual per-week data is available for the autumn observation weeks, but it only adds variability without highlighting long-term trends that are the current focus.

The slopes of Figures 4 and 5 and their smoothed monthly models show high correlation among red-tailed hawk counts and wind speed, inverted temperature, and westerly wind direction for October and November.
Based on climate analysis [1], it is essentially established that there is a cause-and-effect relationship between increasing temperature homogenization and wind stilling. Based on the high correlation between decreasing smoothed wind speed and decreasing smoothed red-tailed hawk counts, it is reasonable to infer cause-and-effect, especially given the placement of North Lookout at the Eckville Fault of the Kittatinny Ridge. The next sections investigate whether there are similar correlations for other raptor species.

3. Sharp-Shinned Hawks (SS)

SS Sep
Figure 6: Normalized Sharp-shinned Hawk Counts and their Smoothed Trends for September 1976 through 2021

Smoothed Linear Regression Model for September 1976 through 2021
SS_All_smooth =
     -0.6472 * HMtempC_mean_smooth +
      0.2628 * WindSpd_mean_smooth +
      1.0818 * wnd_WNW_NW_smooth +
     -0.0895
Correlation coefficient                  0.6623

Smoothed Linear Regression Model for September 1997 through 2021
SS_All_smooth =
      0.4976 * WindSpd_mean_smooth +
      0.506  * wnd_WNW_NW_smooth +
     -0.3073
Correlation coefficient                  0.9037

The sharp-shinned hawk count trend in the latter model starting in 1997 gives comparable weight for wind speed and northwesterly wind trends for the range of [499, 3971] raptors.
 
SS Oct

Figure 7: Normalized Sharp-shinned Hawk Counts and their Smoothed Trends for October 1976 through 2021
 
Smoothed Linear Regression Model for October 1976 through 2021
SS_All_smooth =
      0.3389 * WindSpd_mean_smooth +
      0.205
Correlation coefficient                  0.565

Smoothed Linear Regression Model for October 1997 through 2021
SS_All_smooth =
      0.7249 * WindSpd_mean_smooth +
      0.0149
Correlation coefficient                  0.8518

Note how the slopes converge around 1997 onward, with a 80.8% improvement in CC and identification of wind speed slope as the main correlate.

Sharp-shin counts for November are in the range [26, 321] which is much smaller and less significant for analysis than September and October numbers.

Smoothed trends in wind speed, temperature, and northwesterly winds are highly correlated factors in sharp-shinned count trends in September and October for the years 1997 through 2021.

4. American Kestrel (AK)

Only 8 kestrels appear in the November graph, so this section models only September and October, with secondary models starting in 1993 where the attribute slopes converge.

AK Sep

Figure 8: Normalized American Kestrel Counts and their Smoothed Trends for September 1976 through 2021

Smoothed Linear Regression Model for September 1976 through 2021
AK_All_smooth =
     -0.4676 * HMtempC_mean_smooth +
      0.9308 * WindSpd_mean_smooth +
      0.7475 * wnd_WNW_NW_smooth +
     -0.1336
Correlation coefficient                  0.8737

Smoothed Linear Regression Model for September 1993 through 2021

AK_All_smooth =
     -0.5722 * HMtempC_mean_smooth +
      0.9547 * WindSpd_mean_smooth +
      0.7225 * wnd_WNW_NW_smooth +
     -0.0702
Correlation coefficient                  0.9061

AK Oct

Figure 9: Normalized American Kestrel Counts and their Smoothed Trends for October 1976 through 2021

Smoothed Linear Regression Model for October 1976 through 2021
AK_All_smooth =
     -0.5467 * WindSpd_mean_smooth +
      1.2578 * wnd_WNW_NW_smooth +
     -0.0172
Correlation coefficient                  0.6207


Smoothed Linear Regression Model for October 1993 through 2021

AK_All_smooth =
      0.8748 * WindSpd_mean_smooth +
      0.0268
Correlation coefficient                  0.8882

The high CC values for smoothed AK values in September and October for 1993 through 2021 in Figures 8 and 9 and their linear models demonstrate that declining wind speed trends are highly correlated with declining AK counts.

5. Broad-Winged Hawks.

Considering the essentially horizontal smoothed slope in BW across the years 1976-2021, Weka extracts a good (not excellent) Linear model. The overwhelming majority of BWs cross North Lookout in September, so that is the only BW graph appearing.

BW Sep

Figure 10: Normalized Broad-winged Hawk Counts and their Smoothed Trends for September 1976 through 2021


Smoothed Linear Regression Model for September 1976 through 2021
BW_All_smooth =
     -1.0755 * HMtempC_mean_smooth +
     -0.3081 * WindSpd_mean_smooth +
      0.3085 * wnd_WNW_NW_smooth +
      0.8493
Correlation coefficient                  0.7395

This model shows that smoothed wind speed slope is the least important for BW of the three climate attributes modeled, both in magnitude and in direction. Negatively correlated temperature tracks BW the most closely.

6. Cooper's Hawk

October is the large-count month for CH, [79, 922] compared to [23, 290] for September and [2, 91] for November.

CH Oct

Figure 11: Normalized Cooper's Hawk Counts and their Smoothed Trends for October 1976 through 2021


Smoothed Linear Regression Model for October 1976 through 2021
CH_All_smooth =
      0.9705 * HMtempC_mean_smooth +
      1.2619 * wnd_WNW_NW_smooth +
     -0.8241
Correlation coefficient                  0.9529

In the earlier years, when CH and wind speed trends head in opposite directions, temperature and westerly wind directions in the above model yield a high CC. CH and wind speed trend slopes converge around 2001.

Smoothed Linear Regression Model for October 2001 through 2021

CH_All_smooth =
     -1.0191 * HMtempC_mean_smooth +
      0.5729 * wnd_WNW_NW_smooth +
      0.8067
Correlation coefficient                  0.8226

Eliminating all attributes other than WindSpd_mean_smooth and CH_All_smooth yields this model:

Smoothed Linear Regression Model for October 2001 through 2021 using only smoothed wind speed
CH_All_smooth =
      0.8285 * WindSpd_mean_smooth +
      0.1109
Correlation coefficient                  0.8659


Finally, Weka's attribute ranker gives these CCs for individual attribute correlations to smoothed CH:

Ranked attributes:
 0.892  2 WindSpd_mean_smooth
 0.866  3 wnd_WNW_NW_smooth
-0.887  1 HMtempC_mean_smooth

All attributes have high correlations and very similar Figure 11 slopes to CH starting in 2001.

7. Osprey (OS)

Osprey have significant numbers in September and October.
November has the range [0, 15] and does not appear here.
 
OS Sep

Figure 12: Normalized Osprey Counts and their Smoothed Trends for September 1976 through 2021

Smoothed Linear Regression Model for September 1976 through 2021

OS_All_smooth =
      1.5448 * HMtempC_mean_smooth +
      1.5469 * WindSpd_mean_smooth +
     -0.7351 * wnd_WNW_NW_smooth +
     -0.7289
Correlation coefficient                  0.6745

Smoothed Linear Regression Model for September 2007 through 2021

OS_All_smooth =
     -1.122  * HMtempC_mean_smooth +
      1.6867 * WindSpd_mean_smooth +
     -0.6937 * wnd_WNW_NW_smooth +
      0.8986
Correlation coefficient                  0.9687

Smoothed Linear Regression Model for September 2007 through 2021 with only smoothed wind speed and OS raptor counts

OS_All_smooth =
      1.8261 * WindSpd_mean_smooth +
     -0.2104
Correlation coefficient                  0.9409


OS Oct

Figure 13: Normalized Osprey Counts and their Smoothed Trends for October 1976 through 2021


Smoothed Linear Regression Model for October 1976 through 2021
OS_All_smooth =
     -0.6971 * WindSpd_mean_smooth +
      1.1454 * wnd_WNW_NW_smooth +
     -0.0188
Correlation coefficient                  0.7781

Smoothed Linear Regression Model for October 2003 through 2021
OS_All_smooth =
      0.9544 * WindSpd_mean_smooth +
     -0.1151
Correlation coefficient                  0.9284

Wind speed trends are important for Osprey trends in September and October, but the other attributes considered can play important roles in September for later years when included in the data.

8. Northern Harrier

Northern Harrier counts are consistent across all three months.

NH Sep

Figure 14: Normalized Northern Harrier Counts and their Smoothed Trends for September 1976 through 2021

Smoothed Linear Regression Model for September 1976 through 2021
NH_All_smooth =
     -1.7604 * HMtempC_mean_smooth +
      1.5325 * wnd_WNW_NW_smooth +
      0.5869
Correlation coefficient                  0.8034

Smoothed Linear Regression Model for September 1999 through 2021
NH_All_smooth =
      0.8599 * WindSpd_mean_smooth +
     -0.0936
Correlation coefficient                  0.9456

NH Oct

Figure 15: Normalized Northern Harrier Counts and their Smoothed Trends for October 1976 through 2021

Smoothed Linear Regression Model for October 1976 through 2021
NH_All_smooth =
      0.6909 * wnd_WNW_NW_smooth +
      0.0964
Correlation coefficient                  0.0441

Smoothed Linear Regression Model for October 1999 through 2021
NH_All_smooth =
      1.8739 * WindSpd_mean_smooth +
     -0.5135 * wnd_WNW_NW_smooth +
     -0.1101
Correlation coefficient                  0.9441

NH Nov

Figure 16: Normalized Northern Harrier Counts and their Smoothed Trends for November 1976 through 2021

Smoothed Linear Regression Model for November 1976 through 2021
NH_All_smooth =
      0.936  * WindSpd_mean_smooth +
     -0.38   * wnd_WNW_NW_smooth +
      0.1661
Correlation coefficient                  0.9166

Smoothed Linear Regression Model for November 1999 through 2021
NH_All_smooth =
      0.9751 * WindSpd_mean_smooth +
      0.555  * wnd_WNW_NW_smooth +
     -0.3517
Correlation coefficient                  0.97

Northern Harrier trends consistently track wind speed trends with high CC values starting in 1999 when their slope trends align with the other climate attributes.

9. Northern Goshawk (NG)

Northern Goshawk is the final species considered in this summer 2023 study. September's counts are in the low range [0, 4], so we examine only October and November. Rough-legged Hawk counts peak at [0, 17] in November, so they do not appear in this study.

NG Oct

Figure 17: Normalized Northern Goshawk Counts and their Smoothed Trends for October 1976 through 2021

Smoothed Linear Regression Model for October 1976 through 2021
NG_All_smooth =
      0.3532 * WindSpd_mean_smooth +
      0.1128
Correlation coefficient                  0.5648

Smoothed Linear Regression Model for October 1999 through 2021
NG_All_smooth =
      1.9465 * WindSpd_mean_smooth +
     -1.0484 * wnd_WNW_NW_smooth +
     -0.0324
Correlation coefficient                  0.8953

NG Nov

Figure 18: Normalized Northern Goshawk Counts and their Smoothed Trends for November 1976 through 2021

Smoothed Linear Regression Model for November 1976 through 2021
NG_All_smooth =
      1.0091 * WindSpd_mean_smooth +
     -0.2583 * wnd_WNW_NW_smooth +
      0.1072
Correlation coefficient                  0.8896

Smoothed Linear Regression Model for November 1999 through 2021
NG_All_smooth =
      1.1591 * WindSpd_mean_smooth +
     -0.0847
Correlation coefficient                  0.9634

Models for all three months show the highest correlation of smoothed NG counts with smoothed wind speed averages from 1999 through 2021.

10. Correlation Table and Conclusions

Table 1 below shows the smoothed monthly climate attributes with the highest individual correlation coefficient magnitudes (positive and negative) [9] to the smoothed named-raptor count in the first column, which also gives the raptor count range for that month in 1976 through 2021. The Start and End years are the same as those for the Linear Expression models above for trailing years in which the smoothed raptor count slopes converge with
HMtempC_mean_smooth, WindSpd_mean_smooth, and wnd_WNW_NW_smooth. The second-to-last column shows the smoothed attribute-to-raptor CC in the range [-1.0, 1.0] as before, the integer index in the data set (ignore it), and the climate attribute name. Recall that all attributes are normalized into the range [0.0, 1.0] using the formula NormalizedValue = ((Value - MinValue) / (MaxValue - MinValue)), in order to get values into the same range, before smoothing using the formula SmoothedValuetimeT = (alpha X NormalizedValuetimeT) + ((1.0 - alpha) X NormalizedValuetimeT-1) [6], with alpha = 0.1 in this analysis for substantial smoothing of peaks and valleys. The last column shows the equivalent CC values for the un-smoothed attributes, taking into account peak, valley, and year-to-year slopes for the data graphed in the above figures. Wind directions and raptor attributes are counters and others are standard statistical measures. HMtempC is NOT inverted after normalization via the formula 1.0 - NormalizedHMtempC in order to invert the slope; that inversion applies only in the graphs. The following list gives all of the climate attributes that Weka correlates in CC values in Table 1. The year and month are removed from the data before extracting CC values since they allow trivial mapping to raptor counts via memorization without considering patterns in climate change. The "pstdev" naming convention in attribute names indicates population standard deviation for that attribute; "wndUNK" is wind unknown for an observation in which no wind or mixed-direction breezes were present.

year, month, HMtempC_mean_smooth, WindSpd_mean_smooth, HMtempC_median_smooth,
WindSpd_median_smooth, HMtempC_pstdv_smooth, WindSpd_pstdv_smooth,
HMtempC_min_smooth, WindSpd_min_smooth, HMtempC_max_smooth, WindSpd_max_smooth,
wndN_smooth, wndNNE_smooth, wndNE_smooth, wndENE_smooth, wndE_smooth,
wndESE_smooth, wndSE_smooth, wndSSE_smooth, wndS_smooth, wndSSW_smooth,
wndSW_smooth, wndWSW_smooth, wndW_smooth, wndNNW_smooth, wndUNK_smooth,
wnd_WNW_NW_smooth

List 1: Attributes considered in the CC extraction of Table 1 below except year and month.

Raptor
Month
Start
End
Smoothed Attribute CC weights
Un-smoothed Attribute CC weights
RT [22, 208]
September
2008
2021
 0.855   24 wndNNW_smooth
 0.848    2 WindSpd_mean_smooth
 0.832   10 WindSpd_max_smooth
 0.814    6 WindSpd_pstdv_smooth
 0.801    4 WindSpd_median_smooth
-0.861   13 wndNE_smooth
-0.874   22 wndWSW_smooth
 0.4738   26 wnd_WNW_NW
 0.452     2 WindSpd_mean
 0.4467    6 WindSpd_pstdv
 0.4003   20 wndSSW
 0.3696   10 WindSpd_max
-0.4082   22 wndWSW
RT [159, 2643]
October
1990
2021
 0.9659    4 WindSpd_median_smooth
 0.9093    2 WindSpd_mean_smooth
 0.7524   11 wndN_smooth
 0.7511   26 wnd_WNW_NW_smooth
-0.7581    1 HMtempC_mean_smooth
-0.8048   22 wndWSW_smooth
-0.8073    9 HMtempC_max_smooth
-0.8223   15 wndE_smooth
-0.8569   20 wndSSW_smooth
-0.8591   25 wndUNK_smooth
-0.888    12 wndNNE_smooth
 0.62381    2 WindSpd_mean
 0.57893    4 WindSpd_median
 0.45581   26 wnd_WNW_NW
 0.35943    6 WindSpd_pstdv
-0.28665   15 wndE
-0.32198   20 wndSSW
-0.34612   13 wndNE
RT [589, 4195]
November
1985
2021
 0.963    2 WindSpd_mean_smooth
 0.958    6 WindSpd_pstdv_smooth
 0.937   10 WindSpd_max_smooth
 0.932    4 WindSpd_median_smooth
 0.836   11 wndN_smooth
-0.864   12 wndNNE_smooth
-0.885   14 wndENE_smooth
-0.925   25 wndUNK_smooth
-0.926   16 wndESE_smooth
 0.5319   10 WindSpd_max
 0.5014    6 WindSpd_pstdv
 0.4317    2 WindSpd_mean
 0.3088    8 WindSpd_min
-0.2046   12 wndNNE
-0.2164   16 wndESE
-0.2256   14 wndENE
-0.229    13 wndNE
-0.4659   25 wndUNK
SS [499, 3971]
September
1997
2021
 0.9395    6 WindSpd_pstdv_smooth
 0.908     2 WindSpd_mean_smooth
 0.8532   10 WindSpd_max_smooth
 0.8152    4 WindSpd_median_smooth
-0.8198   12 wndNNE_smooth
-0.8433   25 wndUNK_smooth
-0.9061   15 wndE_smooth
-0.9081   14 wndENE_smooth
-0.9499   13 wndNE_smooth
 0.402     8 WindSpd_min
 0.3279   21 wndSW
 0.2938   17 wndSE
 0.2628   23 wndW
 0.2611    2 WindSpd_mean
 0.244    10 WindSpd_max
 0.2329    4 WindSpd_median
-0.2161    1 HMtempC_mean
-0.2301   15 wndE
-0.3431   14 wndENE
-0.6651   13 wndNE
SS [1326, 8915]
October
1997
2021
 0.919    6 WindSpd_pstdv_smooth
 0.885    2 WindSpd_mean_smooth
 0.863   11 wndN_smooth
 0.814    4 WindSpd_median_smooth
 0.7     26 wnd_WNW_NW_smooth
-0.72    13 wndNE_smooth
-0.728   15 wndE_smooth
-0.772    9 HMtempC_max_smooth
-0.789   25 wndUNK_smooth
-0.795    1 HMtempC_mean_smooth
-0.817   20 wndSSW_smooth
-0.825   14 wndENE_smooth
-0.857   12 wndNNE_smooth
-0.862   16 wndESE_smooth
-0.888   22 wndWSW_smooth
 0.576668   26 wnd_WNW_NW
 0.566421    2 WindSpd_mean
 0.499188    4 WindSpd_median
 0.307796    8 WindSpd_min
-0.365702   20 wndSSW
-0.376211    9 HMtempC_max
-0.457445   16 wndESE
AK [114, 537]
September
1993
2021
 0.9227    8 WindSpd_pstdv_smooth
 0.9109    4 WindSpd_mean_smooth
 0.855     6 WindSpd_median_smooth
 0.781    12 WindSpd_max_smooth
 0.7325    7 HMtempC_pstdv_smooth
 0.7186   13 wndN_smooth
 0.6846   28 wnd_WNW_NW_smooth
-0.7984    7 HMtempC_min_smooth
-0.8366   15 wndE_smooth
-0.854    22 wndWSW_smooth
-0.8587   25 wndUNK_smooth
-0.8638   14 wndENE_smooth
-0.9365   13 wndNE_smooth
 0.35081    23 wndSW
 0.295112    4 WindSpd_mean
 0.294594    6 WindSpd_median
 0.274253   28 wnd_WNW_NW
-0.30252    25 wndUNK
-0.306995   14 wndENE
-0.356796   15 wndE
-0.366446   13 wndNE
AK [53, 388]
October
1993
2021
 0.93644    4 WindSpd_median_smooth
 0.90761    2 WindSpd_mean_smooth
 0.7955    11 wndN_smooth
 0.72848   26 wnd_WNW_NW_smooth
 0.67275    6 WindSpd_pstdv_smooth
-0.8099     1 HMtempC_mean_smooth
-0.81811   20 wndSSW_smooth
-0.84077   22 wndWSW_smooth
-0.84955   15 wndE_smooth
-0.87603   25 wndUNK_smooth
-0.9006    12 wndNNE_smooth
 0.4437     2 WindSpd_mean
 0.43089    4 WindSpd_median
-0.29625    7 HMtempC_min
-0.30318   14 wndENE
-0.38468   25 wndUNK
-0.40377   15 wndE
BW [1570, 29422]
September 1976
2021
 0.7984    7 HMtempC_min_smooth
 0.4819    8 WindSpd_min_smooth
 0.4484   26 wnd_WNW_NW_smooth
-0.7539   20 wndSSW_smooth
-0.7893    5 HMtempC_pstdv_smooth
-0.82     19 wndS_smooth
-0.8242   17 wndSE_smooth
-0.8327   23 wndW_smooth
-0.8532    9 HMtempC_max_smooth
0.23428    8 WindSpd_min
0.23204   21 wndSW
0.21894   11 wndN
-0.23942    3 HMtempC_median
-0.27075    5 HMtempC_pstdv
-0.28997   23 wndW
-0.36532    1 HMtempC_mean
-0.45654    9 HMtempC_max
CH [79, 922]
October
1976
2021
 0.9296    7 HMtempC_min_smooth
 0.9205    1 HMtempC_mean_smooth
 0.9096    3 HMtempC_median_smooth
 0.8954    9 HMtempC_max_smooth
 0.8925   23 wndW_smooth
-0.9035   10 WindSpd_max_smooth
-0.9071    6 WindSpd_pstdv_smooth
-0.9107   13 wndNE_smooth
 0.47849   24 wndNNW
 0.3112    18 wndSSE
 0.29261    4 WindSpd_median
 0.24865   26 wnd_WNW_NW
-0.30688   13 wndNE
CH [79, 922]
October
2001
2021
 0.8922    2 WindSpd_mean_smooth
 0.8825    4 WindSpd_median_smooth
 0.8662   26 wnd_WNW_NW_smooth
 0.7318   11 wndN_smooth
-0.7645    9 HMtempC_max_smooth
-0.77     13 wndNE_smooth
-0.8127    7 HMtempC_min_smooth
-0.813    12 wndNNE_smooth
-0.8226   20 wndSSW_smooth
-0.8282    3 HMtempC_median_smooth
-0.8867    1 HMtempC_mean_smooth
 0.64254    4 WindSpd_median
 0.58915    2 WindSpd_mean
 0.53846   26 wnd_WNW_NW
 0.42592   24 wndNNW
-0.32187    9 HMtempC_max
-0.35703   15 wndE
OS [190, 544]
September
2007
2021
 0.9648    4 WindSpd_median_smooth
 0.9534    2 WindSpd_mean_smooth
 0.9026   10 WindSpd_max_smooth
 0.891     6 WindSpd_pstdv_smooth
 0.8206   24 wndNNW_smooth
-0.6809    1 HMtempC_mean_smooth
-0.7742   12 wndNNE_smooth
-0.8209   19 wndS_smooth
-0.9084   22 wndWSW_smooth
-0.9661   13 wndNE_smooth
 0.3912   10 WindSpd_max
 0.3269   17 wndSE
 0.3231    2 WindSpd_mean
 0.3136   23 wndW
-0.3702   11 wndN
-0.624    13 wndNE
OS [34, 379]
October
2003
2021
 0.9509    2 WindSpd_mean_smooth
 0.9277    4 WindSpd_median_smooth
 0.7998    6 WindSpd_pstdv_smooth
 0.7912   26 wnd_WNW_NW_smooth
-0.8723   12 wndNNE_smooth
-0.8731    7 HMtempC_min_smooth
-0.8903   13 wndNE_smooth
-0.9286   20 wndSSW_smooth
-0.9289    1 HMtempC_mean_smooth
 0.4813    2 WindSpd_mean
 0.4483    6 WindSpd_pstdv
 0.4327    8 WindSpd_min
 0.3554    4 WindSpd_median
 0.343    10 WindSpd_max
-0.298     1 HMtempC_mean
-0.3048   16 wndESE
-0.344     9 HMtempC_max
NH [18, 176]
September
1999
2021
 0.9674    2 WindSpd_mean_smooth
 0.9624    4 WindSpd_median_smooth
 0.9393    6 WindSpd_pstdv_smooth
 0.9151   10 WindSpd_max_smooth
 -0.7716   25 wndUNK_smooth
-0.7787    7 HMtempC_min_smooth
-0.8578   19 wndS_smooth
-0.9099   22 wndWSW_smooth
-0.965    13 wndNE_smooth
 0.56432    4 WindSpd_median
 0.53422    2 WindSpd_mean
 0.44983   10 WindSpd_max
 0.35369    6 WindSpd_pstdv
 0.32457    8 WindSpd_min
-0.3944    22 wndWSW
-0.55946   13 wndNE
NH [28, 198]
October
1999
2021
 0.9541    2 WindSpd_mean_smooth
 0.9467    4 WindSpd_median_smooth
 0.9227   11 wndN_smooth
 0.8335    6 WindSpd_pstdv_smooth
 0.8253   17 wndSE_smooth
 0.7615   26 wnd_WNW_NW_smooth
-0.8386   20 wndSSW_smooth
-0.8852   25 wndUNK_smooth
-0.904     1 HMtempC_mean_smooth
-0.9102   12 wndNNE_smooth
-0.9168   22 wndWSW_smooth
 0.50048    2 WindSpd_mean
 0.46024    8 WindSpd_min
 0.432      4 WindSpd_median
 0.3601     6 WindSpd_pstdv
 0.33506   26 wnd_WNW_NW
-0.35149    9 HMtempC_max
-0.35361   16 wndESE
NH [15, 127]
November
1999
2021
 0.9675    4 WindSpd_median_smooth
 0.967     2 WindSpd_mean_smooth
 0.9595    6 WindSpd_pstdv_smooth
 0.9447   10 WindSpd_max_smooth
 0.8708   11 wndN_smooth
-0.8487   14 wndENE_smooth
-0.9112   23 wndW_smooth
-0.9251   19 wndS_smooth
-0.9313   16 wndESE_smooth
-0.9486   25 wndUNK_smooth
 0.4868    3 HMtempC_median
 0.4684    1 HMtempC_mean
 0.4442   17 wndSE
 0.4188   22 wndWSW
 0.3846   18 wndSSE
 0.2843   21 wndSW
 0.2705    2 WindSpd_mean
-0.2238   25 wndUNK
-0.3121   15 wndE
-0.3461   11 wndN
-0.5411   23 wndW
NG [0, 64]
October
1999
2021
 0.94086   11 wndN_smooth
 0.8868     2 WindSpd_mean_smooth
 0.88609    4 WindSpd_median_smooth
 0.84481    6 WindSpd_pstdv_smooth
 0.80955   17 wndSE_smooth
 0.63558   26 wnd_WNW_NW_smooth
-0.81627   15 wndE_smooth
-0.83264    1 HMtempC_mean_smooth
-0.86919   12 wndNNE_smooth
-0.90072   25 wndUNK_smooth
-0.96956   22 wndWSW_smooth
 0.29448    8 WindSpd_pstdv
 0.28114   20 wndSSE
 0.2533     4 WindSpd_mean
 0.23943   10 WindSpd_min
-0.18266    3 HMtempC_median
-0.19856   24 wndNNW
-0.21504    1 HMtempC_mean
-0.29409   13 wndNE
-0.34472    9 HMtempC_max
NG [1, 95]
November
1999
2021
 0.9748    2 WindSpd_mean_smooth
 0.9668    4 WindSpd_median_smooth
 0.9543    6 WindSpd_pstdv_smooth
 0.9233   10 WindSpd_max_smooth
 0.9152   11 wndN_smooth
-0.8053   14 wndENE_smooth
-0.867    23 wndW_smooth
-0.8889   16 wndESE_smooth
-0.9098   19 wndS_smooth
-0.9141   25 wndUNK_smooth
 0.60903   24 wndNNW
 0.44453   22 wndWSW
 0.39398    2 WindSpd_mean
-0.25998    8 WindSpd_min
-0.27292   19 wndS

Table 1: Strongest correlation coefficients of smoothed & un-smoothed monthly climate properties to raptor counts

In the smoothed column of Table 1, WindSpd_mean_smooth or WindSpd_median_smooth, highlighted in bold, appears within the top two most positively correlated attributes for raptor-month pairings, constrained by trailing years corresponding to aligned smoothed slopes in the graphs, except for Broad-winged Hawks (BW) in September across all years
1976 through 2021 and Cooper's Hawks (CH) in October across all years. CH in October for 2001 through 2021 shows WindSpd_mean_smooth and WindSpd_median_smooth as the two most highly-correlated attributes.

In the un-smoothed column of Table 1, WindSpd_mean or WindSpd_median, highlighted in bold, appears within most of the top three most positively correlated attributes for raptor-month pairings, constrained by trailing years. The exceptions are Sharp-shinned Hawks in September (these wind speed measures are in fifth and seventh places), Broad-winged Hawks as in the smoothed column, and Northern Harriers in November, where WindSpd_mean's CC is in seventh place. This un-smoothed column shows generally lower CC values because of temporal misalignment of peaks, valleys, and month-to-month slopes among the attributes. As noted before, the un-smoothed view of these data is not intended to show long-term trends. The smoothed and un-smoothed variants of , , appear as strong correlates for some of these raptor species, but not as generally strong as WindSpd_mean and WindSpd_median, which dominate the correlates. Wind speed correlates highly with raptor counts. Previous graphs show the decline in mean wind speed for more recent years. A few graphs showing trends in all wind speed and temperature parameters at North Lookout sets up completion of this discussion.

wnd_WNW_NWunderlined in Table 1 for emphasis


wind 9

Figure 19: Wind Speed Un-smoothed and Smoothed Trends in September
September slopes show a gradual decline since 2009 with a rounded mean wind speed range of [5.5, 12.0] km/hour.


wind oct

Figure 20: Wind Speed Un-smoothed and Smoothed Trends in October
October slopes show a steeper, consistent decline since 1976 with a rounded mean wind speed range of [6.0, 15.6] km/hour. While September's range of [5.5, 12.0] has a max-min distance of , October's [6.0, 15.6] has a max-min distance of , a 47.7% greater downslope from highest to lowest measure than in September. Notably, October and November are the prime raptor migration and observation months for many species. November's mean wind speed range in the next graph is [6.8. 16.8] km/hours, a slightly greater max-min distance of . The peaks in October are mostly missing in November of recent years.
6.5 km/hour9.6 km/hour10 km/hour

wind 11

Figure 21: Wind Speed Un-smoothed and Smoothed Trends in November

temp 9

Figure 22: Temperature Celsius Un-smoothed and Smoothed Trends in September
Smoothed September monthly temperatures are roughly level in recent years.


temp 10

Figure 23: Temperature Celsius Un-smoothed and Smoothed Trends in October
October's and November's mean and median temperature have continued to grow at a gradual rate after rapid growth early in this span of years.


temp 11

Figure 24: Temperature Celsius Un-smoothed and Smoothed Trends in November
As seen from Table 1 and Figures 19 through 21, especially for the prime observation months of October and November in Figures 20 and 21, wind speed measures that correlate strongly with most raptor species counts are consistently declining during observation periods. There are three potential hypothesis about the declining raptor counts. A) Diminishing updrafts on the north-northwest side of the Kittatinny Ridge are leading the raptors to cross the mountain at more widespread locations instead of funneling them past North Lookout and across the Eckville Fault. B) Raptors are wintering further north, perhaps due to increasing temperatures. C) Raptor populations are declining in numbers. The next step in this investigation would be to look for trends in the raptor counts during the spring, northerly migration. If there has been no significant change in the last quarter century, that would indicate alternative (A). This concludes this stage of the study.

References

1. Global ‘Stilling’: Is Climate Change Slowing Down the Wind? Jim Robbins, Yale School of the Environment, September 13, 2022.
    https://e360.yale.edu/features/global-stilling-is-climate-change-slowing-the-worlds-wind

2. Learn About Heat Islands, United States Environmental Protection Agency, https://www.epa.gov/heatislands/learn-about-heat-islands, URL tested June 24, 2023.

3. "The tipping point: The Lehigh Valley faces environmental and public health crises", The Brown and White newsletter, Nik Malhotra, January 20, 2021. https://thebrownandwhite.com/2021/01/20/the-tipping-point-the-lehigh-valley-faces-environmental-and-public-health-crises/

4. Why do migrating raptors concentrate at Hawk Mountain? Hawk Mountain Sanctuary. Raptorpedia. https://www.hawkmountain.org/conservation-science/resources/raptorpedia

5. Discussion with Dr. Laurie Goodrich concerning three-letter wind direction observations at North Lookout, January 2023.

6. A. Pal and P. Prakash, Practical Time Series Analysis, "Chapter 3: Exponential Smoothing based Methods". Packt Publishing, 2017.

7. Weka 3: Machine Learning Software in Java. https://www.cs.waikato.ac.nz/ml/weka/

8. Therrien, et. al, "Long-term phenological shifts in migration and breeding-area residency in eastern North American raptors". The Auk, Ornithological Advances, Volume 134, 2017, pp 871-881.

9. Pearson Correlation Coefficient, scipy.stats.pearsonr, https://docs.scipy.org/doc/scipy/reference/generated/scipy.stats.pearsonr.html